How to Read an Audiogram

What is an Audiogram?
After a complete evaluation by an audiologist, he or she will present sounds in a sound-proof room and will record the reaction to the sounds on a chart called audiogram. An audiogram is a graph that shows the softest sounds a person can hear at different pitches or frequencies and displays the results of the hearing test. Although it looks complicated, once you learn how to read it, you will understand it better and with the help of an audiologist, they can determine the best type of hearing aid for you.
A hearing threshold is defined as the softest sound you are able to detect about 50% of the time. Do not worry if you feel like you have “missed” some of the beeps because hearing is not measured in percentage. It is measured in an arbitrary unit of loudness called the decibel with reference to the hearing level (dB HL) instead.

How to read an Audiogram
There are two axes in the audiogram graph, namely the x-axis and y-axis. The horizontal axis (x-axis) represents frequency is plotted at the top of the graph, ranging from low frequencies (250 Hz) on the left to high frequencies (8000 Hz) on the right. You can think of the frequency axis like the keys on a piano with low to high pitches as you progress from left to right.
The vertical axis (y-axis) represents the intensity (loudness) of sound. Sound level, in dB, is plotted on the left side of the graph and ranges from very faint sounds (-10 dB) at the top to very intense sounds (120 dB) at the bottom. Although the top left of the chart is labeled -10 dB or 0 dB that does not mean the absence of sound. Zero decibels actually represents the softest level of sound that the average person with normal hearing will hear, for any given frequency.
The symbol “O” in red is used to represent responses for the right ear while the symbol “X” in blue is used to represent responses for the left ear. The symbol “△“ is used to represent the unmasked bone conduction threshold. Once the lines are joined between the symbols, it tells us about the sounds you can hear (below the lines) and the sounds you can’t hear (above the lines). (Photo credit to Australian Audiology)
How Does Audiogram Measure Hearing?
Sounds are presented in different ways during a hearing test. Sounds go into the ear canal through middle ear to inner ear via earphones or loudspeakers. This is known as air conduction testing. Air conduction testing looks at how the whole hearing system responds to sound.
For bone conduction testing, a device called a bone vibrator is placed behind the ear to send sounds directly to the inner ear, bypassing the outer and middle ear. Sounds are sent through the bones of the head and do not pass through the ear canal or the eardrum.
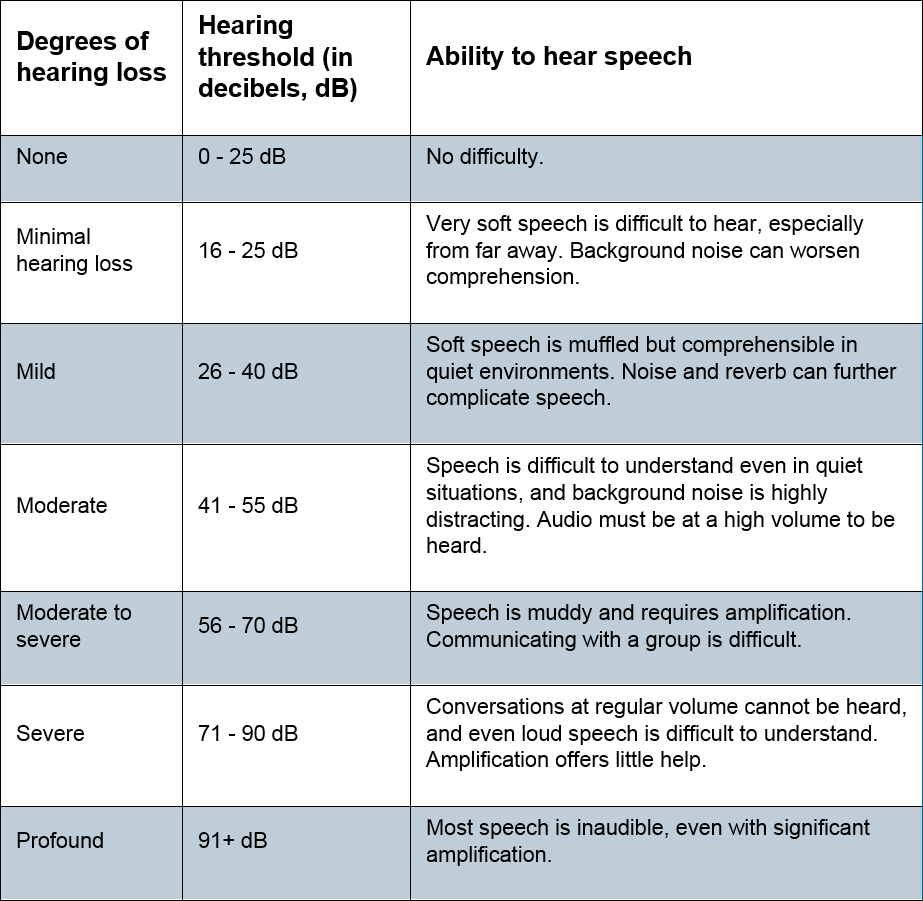
Degree of Hearing Loss and Its Effects
If you have your audiogram result with you, draw a horizontal line at the 20 dB cut-off point that crosses the graph from left to right. If all of your hearing level symbols fall above the line you just drew, the good news that you have normal hearing. If anything is below that 20 dB line, unfortunately, you have hearing loss.
Normal: -10 to 20dB HL
Mild hearing loss: 20 to 40 dB HL
Moderate hearing loss: 40 to 70 dB HL
Severe hearing loss: 70 to 90 dB HL
Profound loss: 90 dB to 120 dB HL
Types of Hearing Loss
- Conductive hearing loss (CHL) is present when something stops sounds from moving through the eardrum and middle ear. Your bone conduction hearing levels will be better than air conduction levels.
- Sensorineural hearing loss (SNHL) is present when sound moves normally through the outer and middle ear, but the inner ear does not work normally. Both bone conduction and air conduction hearing levels will be the same. SNHL occurs when there is damage to your cochlea, hair cells or nerve. Unless sudden hearing loss, otherwise it is often permanent.
- Mixed hearing loss (MHL) is present when there is a problem passing the sound both through the middle ear and inner ear.
Previously, we have also written an article about hearing loss. Click here to understand better how hearing loss occurs.

Speech Banana
Speech banana is the yellow shaded area shown on the audiogram on the right that is the most important for hearing and understanding conversation. Each sound we hear when someone speaks has a different pitch and loudness. For example, the consonant “s” sound is high in pitch and quiet. The vowel “o” sound is low in pitch and louder.
Speech banana comprises the range of pitch and loudness for most speech sounds. Most speech falls into the 250 to 8000 Hz range, with the vowel sounds at low frequencies and the consonants such as S, F, SH, CH, H, TH, T and K sounds among the highest frequencies.
It’s Time to Hear Again
Book an appointment and have an Advanced Diagnostic hearing test by qualified audiologists at SoundLife Hearing. Our package includes:
- Ear history
- Ear check
- Middle ear test
- Diagnostic Pure Tone Audiometry Hearing Test
- Uncomfortable loudness measurement
- Hearing consultation by a professional Audiologist
[one_second][/one_second][one_second][/one_second]
Whatsapp us to enjoy the special discount on the Advance Diagnostic hearing test package with the promo code: Advance PTA, our helpful staff can help you find the appointment that works best for you.